 Google Finance lets you visually compare multiple stocks within one chart. You can also link directly to this graph by passing parameters via URL. For example, to view a graph of Microsoft, Apple, and Google, use the following formatting:
http://finance.google.com/finance?q=MSFT+AAPL+GOOG This is useful if you want to compare all or a subset of stocks in your portfolio. Just bookmark the URL. Ideally, Google Finance will incorporate a "link to this page" feature, similar to Google Maps. This would allow a user to customize their chart and save the results. One complaint I have with this direct linking method is the inability to pass other information via URL, such as time span, ie. 1 month, 3 months, 1 year. Also, if you pass more than 3 stocks, only the first 3 are visible by default, meaning you have to select a check box to bring up each additional stock. With more than 3 stocks selected the chart starts to get cluttered, but I would still like this option.
In the example mentioned above, I was playing with the time axis and noticed an interesting trend over the last 3 years. Since February 2004, Microsoft's value has remained flat, while Google has increased 333% and Apple has increased almost 650%.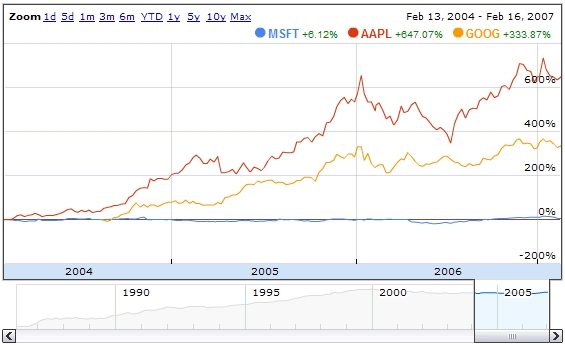
Sunday, February 18, 2007
Comparing multiple stocks in Google Finance
![]()
Subscribe to:
Post Comments (Atom)


No comments:
Post a Comment